![]()

![]()
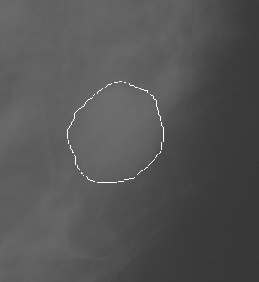
It shows the ground truthed overlay of the abnormality read from the corresponding "OVERLAY" file. The "Show Overlay" option will displays the outline and the "Hide Overlay" option will hide the outline.

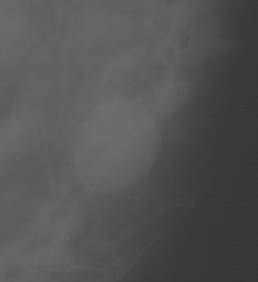
Image without the Overlay

Image with the Overlay
The header of the OVERLAY file has the detailed information of the abnormality. The every overlays are represented with 8 connectivity chain codes starting with the initial point of the chain code. Each chain code of overlay will be ended with '#' key.
TOTAL_ABNORMALITIES 1
ABNORMALITY 1
LESION_TYPE MASS SHAPE N/A MARGIN N/A
ASSESSMENT 0
SUBTLETY 0
M/B 0
PATHOLOGY B
TOTAL_OUTLINES 1
BOUNDARY
110 1491   2 2 2 2 2 2 3 3 2 2 2 2 2 2 2 2 2 2 2 2 2 3
 3 3 2 2 2 2 4 3 2 2 3 3 2 4 3 2 4 3 2 2 2 2 2 3 3 2 4
 3 2 2 2 4 3 2 4 3 2 2 4 3 2 4 3 2 4 3 3 2 4 4 3 2 4 5
 4 5 4 5 4 6 6 5 5 6 5 4 6 6 6 6 6 5 4 6 5 5 6 6 6 6 6
 6 6 6 6 6 5 6 5 6 6 6 6 6 6 6 0 7 6 6 6 6 6 6 6 6 6 6
 6 6 7 7 6 0 7 6 6 6 0 7 6 0 7 6 0 7 6 0 7 7 0 7 7 0 0
 0 0 0 0 0 7 7 0 2 1 0 0 0 0 0 7 6 0 0 2 1 1 1 0 0 0 0
 0 0 0 2 1 #
The indicators on the Control Panel can be used to display the markings directly.

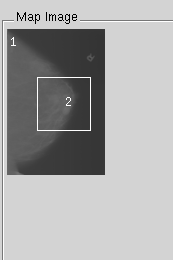
The abnormality is enumerated on the Map Image. Thus, its corresponding detail information can be found under the "Abnoramlity Info.".
