Entry Name: "USF-Malla-MC3"
VAST Challenge
2017
Mini-Challenge 3
Team Members:
Sulav
Malla, University of South Florida, Tampa FL, sulavmalla@mail.usf.edu PRIMARY
Anwesh Tuladhar, University of South Florida, Tampa FL, atuladhar@mail.usf.edu
Ghulam Jilani Quadri, University of
South Florida, Tampa FL, ghulamjilani@mail.usf.edu
Dr. Paul Rosen, University of South Florida, Tampa FL, prosen@usf.edu
Student Team: YES
Tools Used:
Excel
Power point
GIMP
Processing
Approximately how many hours were spent
working on this submission in total?
80 hours.
May we post your submission in the
Visual Analytics Benchmark Repository after VAST Challenge 2017 is complete? YES
Video
http://eng.usf.edu/~sulavmalla/sulav_malla_files/vast2017/usf-malla-mc3-video.mpg
or
Questions
1 - Boonsong Lake resides within the preserve and
has a length of about 3000 feet (see the Boonsong
Lake image file). The image of Boonsong Lake is
oriented north-south and is an RGB image (not six channels as in the supplied
satellite data). Using the Boonsong Lake image as
your guide, analyze and report on the scale and orientation of the supplied
six-channel satellite images. How much area is covered by a pixel in these
images? Please limit your answer to 3 images and 500 words.
We
used processing to read in the provided CSV image data and display/save it as a
jpeg image. Our program is flexible enough to read in all the six bands in the
multi-spectral image data and display a single band as a grayscale image or
multiple bands as a (true or false) color image. We used GIMP image editor to
edit our images. As we can see in Fig. 1, we have the original satellite image
from "image02_2014_08_24.csv" and band 5
(SWIR 1) as a grayscale image. To check the orientation of the lake, we zoom in
to the lake and extract it. This lake was properly scaled and overlapped on top
of the provided image of the lake to be used as a guide. We found that the lake
perfectly overlaps without any rotation. Hence, we conclude that the
orientation of the supplied satellite images is north-south, same as the lake
image provided.
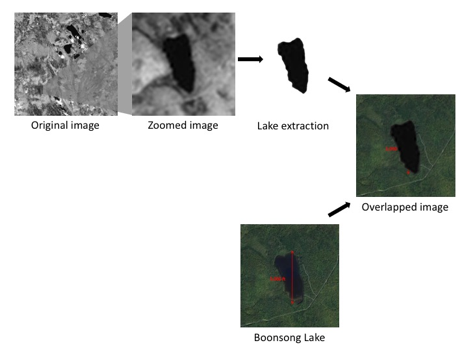
Figure 1: Lake extracted from image 2 and
overlapped onto the provided RGB image.
To find the scale
of the images, we developed a tool in processing to pan and zoom the images as
seen in Fig. 2. Two windows display the actual as well as the zoomed/panned
image. In the zoomed version of the image, there are two lines, black and
white, along with their horizontal location (in pixels) with respect to the
original image. The difference is calculated and displayed on the screen (32
pixels in this example). From the provided guide image, we know that the lake
is 3000 feet long. This enables us to calculate the area covered by a pixel
which is also displayed by our program.
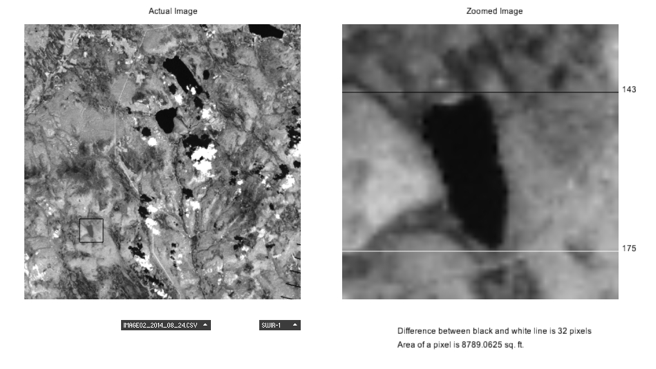
Figure 2: Our program to measure the length of
the lake.
Our program also
has two drop-down widgets to select one of twelve images and one of six bands.
Hence, we can repeat this measurement 72 times (12 images x 6 bands). We
carried out all the measurements and the distribution (histogram) of length of
the lake in pixels is in Fig. 3. Not all images were clear and we could not properly
measure the length of the lake in 11 images. Therefore, we had 61 measured
values. We calculated the area of a single pixel from this measurement. The
mean was found to be 8982.86 sq. ft. with the 95% confidence interval for the
mean being [8856.98 sq. ft., 9108.74 sq. ft.] (8982.86 +- 125.88 sq. ft.).
Therefore, the area of a pixel was about 8982.86 sq. ft. and since the image
was 651 pixels by 651 pixels in size, the scale of the supplied satellite image
is about 11.67 miles by 11.67 miles with a resolution of 94.6 feet.
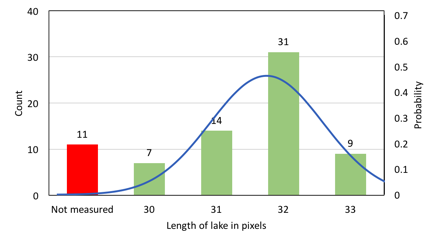
Figure
3: Distribution of measured length of lake (in pixel).
2 - Identify features you can
discern in the Preserve area as captured in the imagery. Focus on image
features that you are reasonably confident that you can identify (e.g., a town
full of houses may be identified with a high confidence level). Please limit
your answer to 6 images and 500 words.
We
extended our tool to map any of the band in the provided satellite data to any
of the red, green, and blue channel of an image to be displayed. To identify
feature in the preserve area we first looked at true color images where the
red, green, and blue bands in the data are mapped to their respective channels.
We identified the following features.
Lakes: We could distinguish 5 big
lakes in the preserve. This was most clearly seen in true color of image 6 of
the satellite data. We can see them as purplish-blue mass as marked in Fig. 4.
The lake marked as 1 is the Boonsong lake of question
1.
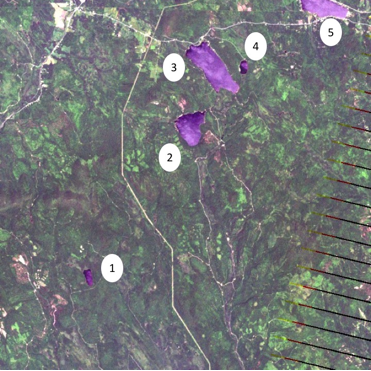
Figure 4: Five lakes marked
in the image.
Roads:
In the same image, we identified roads, some of which are pointed out in Fig.
5. A main road runs north to south almost in the middle of the image. We can
also see many smaller roads. Faint ones may be hiking trails of the preserve
seen on the lower part of the image.
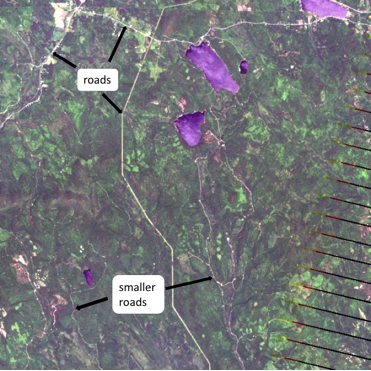
Figure 5: Different roads
identified in the image.
Settlements:
Towards the top left corner of the image we observed settlements. Fig. 6 shows
image 2 and its zoomed version in true color. In the zoomed version, we can see
multiple white dots alongside the road which are probably buildings.
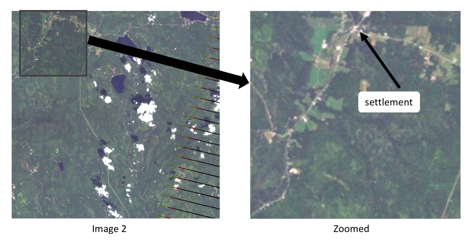
Figure 6: Settlements and
buildings seem as white dots.
River:
We know that Short Wave Infrared (SWIR) 1 is completely absorbed by liquid
water and hence water must appear black in this band. While viewing the images
as grayscale image in this band we noticed a river. In Fig. 7 we have image 6
in true color (left), its zoomed version (middle), and the same zoomed portion
in SWIR 1 band (right). If we look carefully and contrast the middle and the
right image, true color shows roads while SWIR 1 shows the river flowing from
the lake.
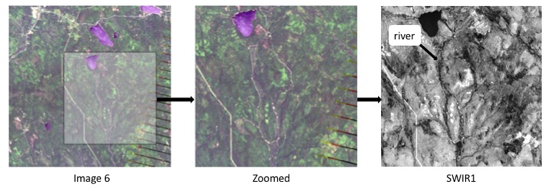
Figure 7: SWIR1 band revels a
river originating from the lake.
Vegetation:
Mapping the bands, Near Infrared (NIR) to red, red to green, and green to blue
channel, we obtain a false color image in which vegetation appear in different
shades of red. Fig. 8 shows this for images 7, 10 and 11 where we observe that
plants cover most of the area. In the zoomed versions (top) we observe bright
red patches on left and right but not in the middle. We believe this area, that
also has settlements, to have seasonal crop plantation. Planted on or before
September (left and right) but harvested during June (middle).
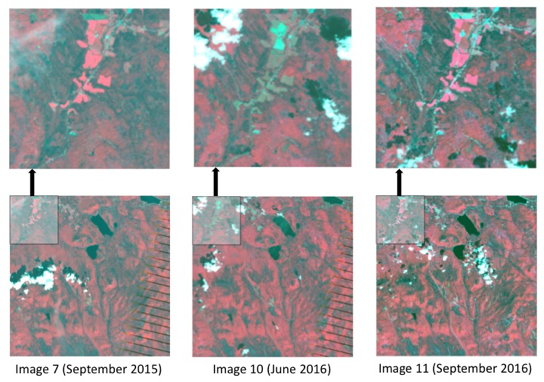
Figure 8: Seasonal crops were
identified in the image.
Snow:
Another false color combination of blue to red, SWIR 1 to green, and SWIR 2 to
blue shows snow/ice in orange or bright red color. We can see this in Fig. 9. Left
image is from image 4 taken in December. We observe redness throughout the
image due to snow. Same place in image 6 taken in June (middle) shown no such
redness due to lack of snow. Finally, image 9 taken in March has snow as well
as clouds (in white). This false color combination is useful in distinguishing
between snow and cloud, both of which appear white in true color.
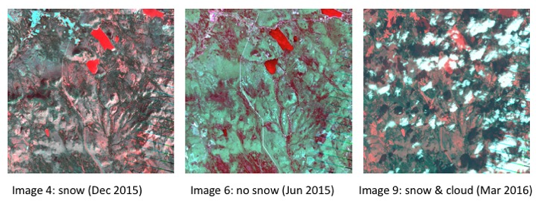
Figure
9: Snow was identified in images taken during winter.
3 - There are most likely
many features in the images that you cannot identify without additional
information about the geography, human activity, and so on. Mitch is interested
in changes that are occurring that may provide him with clues to the problems
with the Pipit bird. Identify features that change over time in these images,
using all channels of the images. Changes may be obvious or subtle, but try not
to be distracted by easily explained phenomena like cloud cover. Please limit
your answer to 6 images and 750 words.
There
were many minor changes between the images like snow, cloud, sensor artifacts
etc. But we found two major changes over time that were persistent and we
believe might have affected the population of the Pipit bird.
Bare grounds at bottom left: Fig.
10 shows image 2 that was taken on August 2014. We zoom the bottom left corner
of this image. We also map the bands, Near Infrared (NIR) to red, red to green,
and green to blue channel (NIR-Red-Green) to monitor plant health.
Additionally, we calculate Normalized Difference Vegetation Index (NDVI) and
plot it as a grayscale image, to differentiate healthy vegetation from barren
land. These two extra plots, NIR-Red-Green and NDVI, are useful in monitoring
vegetation in the zoomed area.
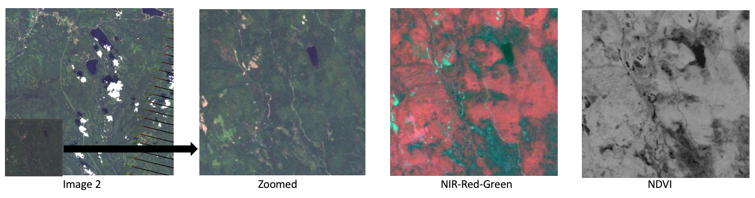
Figure
10: Image 2, its zoomed version, NIR-Red-Green and NDVI.
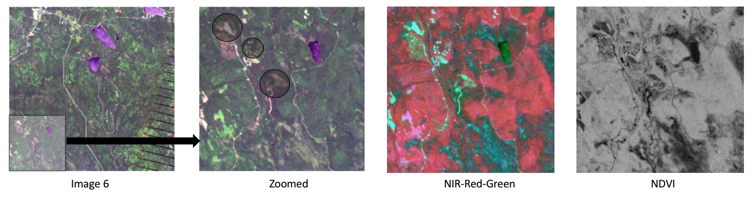
Figure
11: Image 6, its zoomed version (new barren lands circled), NIR-Red-Green and
NDVI.
Fig. 11 shows the same plots for image 6 that was
taken on June 2015. We can clearly see new barren lands in Fig. 11. These parts
are circled in the zoomed RGB image. If we look at the NIR-Red-Green version of
it, we see glowing light green color and clearly stands out from the general
red background suggesting that the area clearly lacks any vegetation. This fact
is corroborated by the NDVI image where the area appears near black suggesting
low NDVI value. There is a road leading to these new barren lands suggesting
they might be new camping areas in the preserve. Such deforestation and
construction of new camping areas might have destroyed the Pipit bird habitat.
Trees that might have contained nests of these bird were cut and cleared.
People camping in this area might have scared away the birds in the surrounding
area. All of this might have led to the decline in Pipit bird population.
New
interconnecting road: Looking towards the middle of the image we
observed that a new road, with more barren land, was constructed. Fig. 12 shows
image 6 again but now a different portion of the image zoomed. In the zoomed
RBG image, we can see a main road on left and another smaller road that goes
alongside the river. Both roads are oriented north to south.
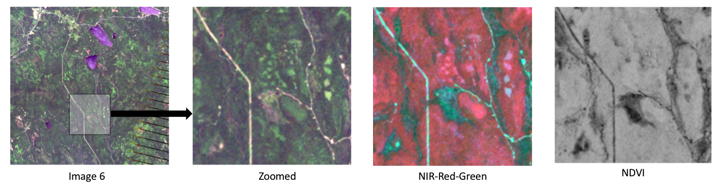
Figure
12: Image 6, its zoomed version, NIR-Red-Green and NDVI.
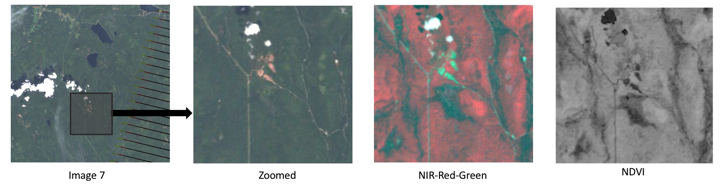
Figure
13: Image 7, its zoomed version (new road and barren land circled),
NIR-Red-Green and NDVI.
In Fig. 13 we have the same spot of
image 7 taken on September 2015 which shows a new interconnecting road that
goes east to west. We also see large barren lands that is circled in the zoomed
image. Again, the vegetation-less land is highlighted as a glowing green patch
in the NIR-Red-Green version and as a black patch in the NDVI image. This new
road connects the main road (with probably more traffic) to the smaller road
(with probably less traffic). This new road might have caused many people using
the main road to take the more scenic route alongside the river, increasing
traffic in that area. Increased car traffic and the noise pollution they bring
with them might have drove the Pipit bird away. Moreover, the barren land
surrounding the newly constructed road surely destroyed any bird habitat that
might have been there before.